Syntax Guide
Statistical Programs
Statistical Primers
Statistical Primers
Interfaces with SPSS, Excel, Ascii, SAS and STATA Formats


This page helps you with the basics of Mplus and lavaan syntax. For a brief summary of Mplus syntax rules see this file and this link. For the Mplus Users guide, click here and for its technical appendix, click here. For an introduction to Mplus by UCLA, click here, here and here. For videos on uses of Mplus, click here. For a free one hour workshop on Mplus programming offerred by Instats, click here. For videos that walk you through Mplus syntax click here, here and here. For frequently asked questions with Mplus, click here. For an introduction to R, click here, here and here, and for more advanced material on R, click here. For video introductions to R, clickhere and here. For an overview and syntax summary of lavaan, see this file and this link. For free on-line courses on lavann, click here and here. For additional lavaan-compatible tools, see semPlot and semTools. My book features Mplus because I believe it has many advantages. However, lavaan is free, it integrates with a powerful stat package (R), and it has many strengths.

M-10
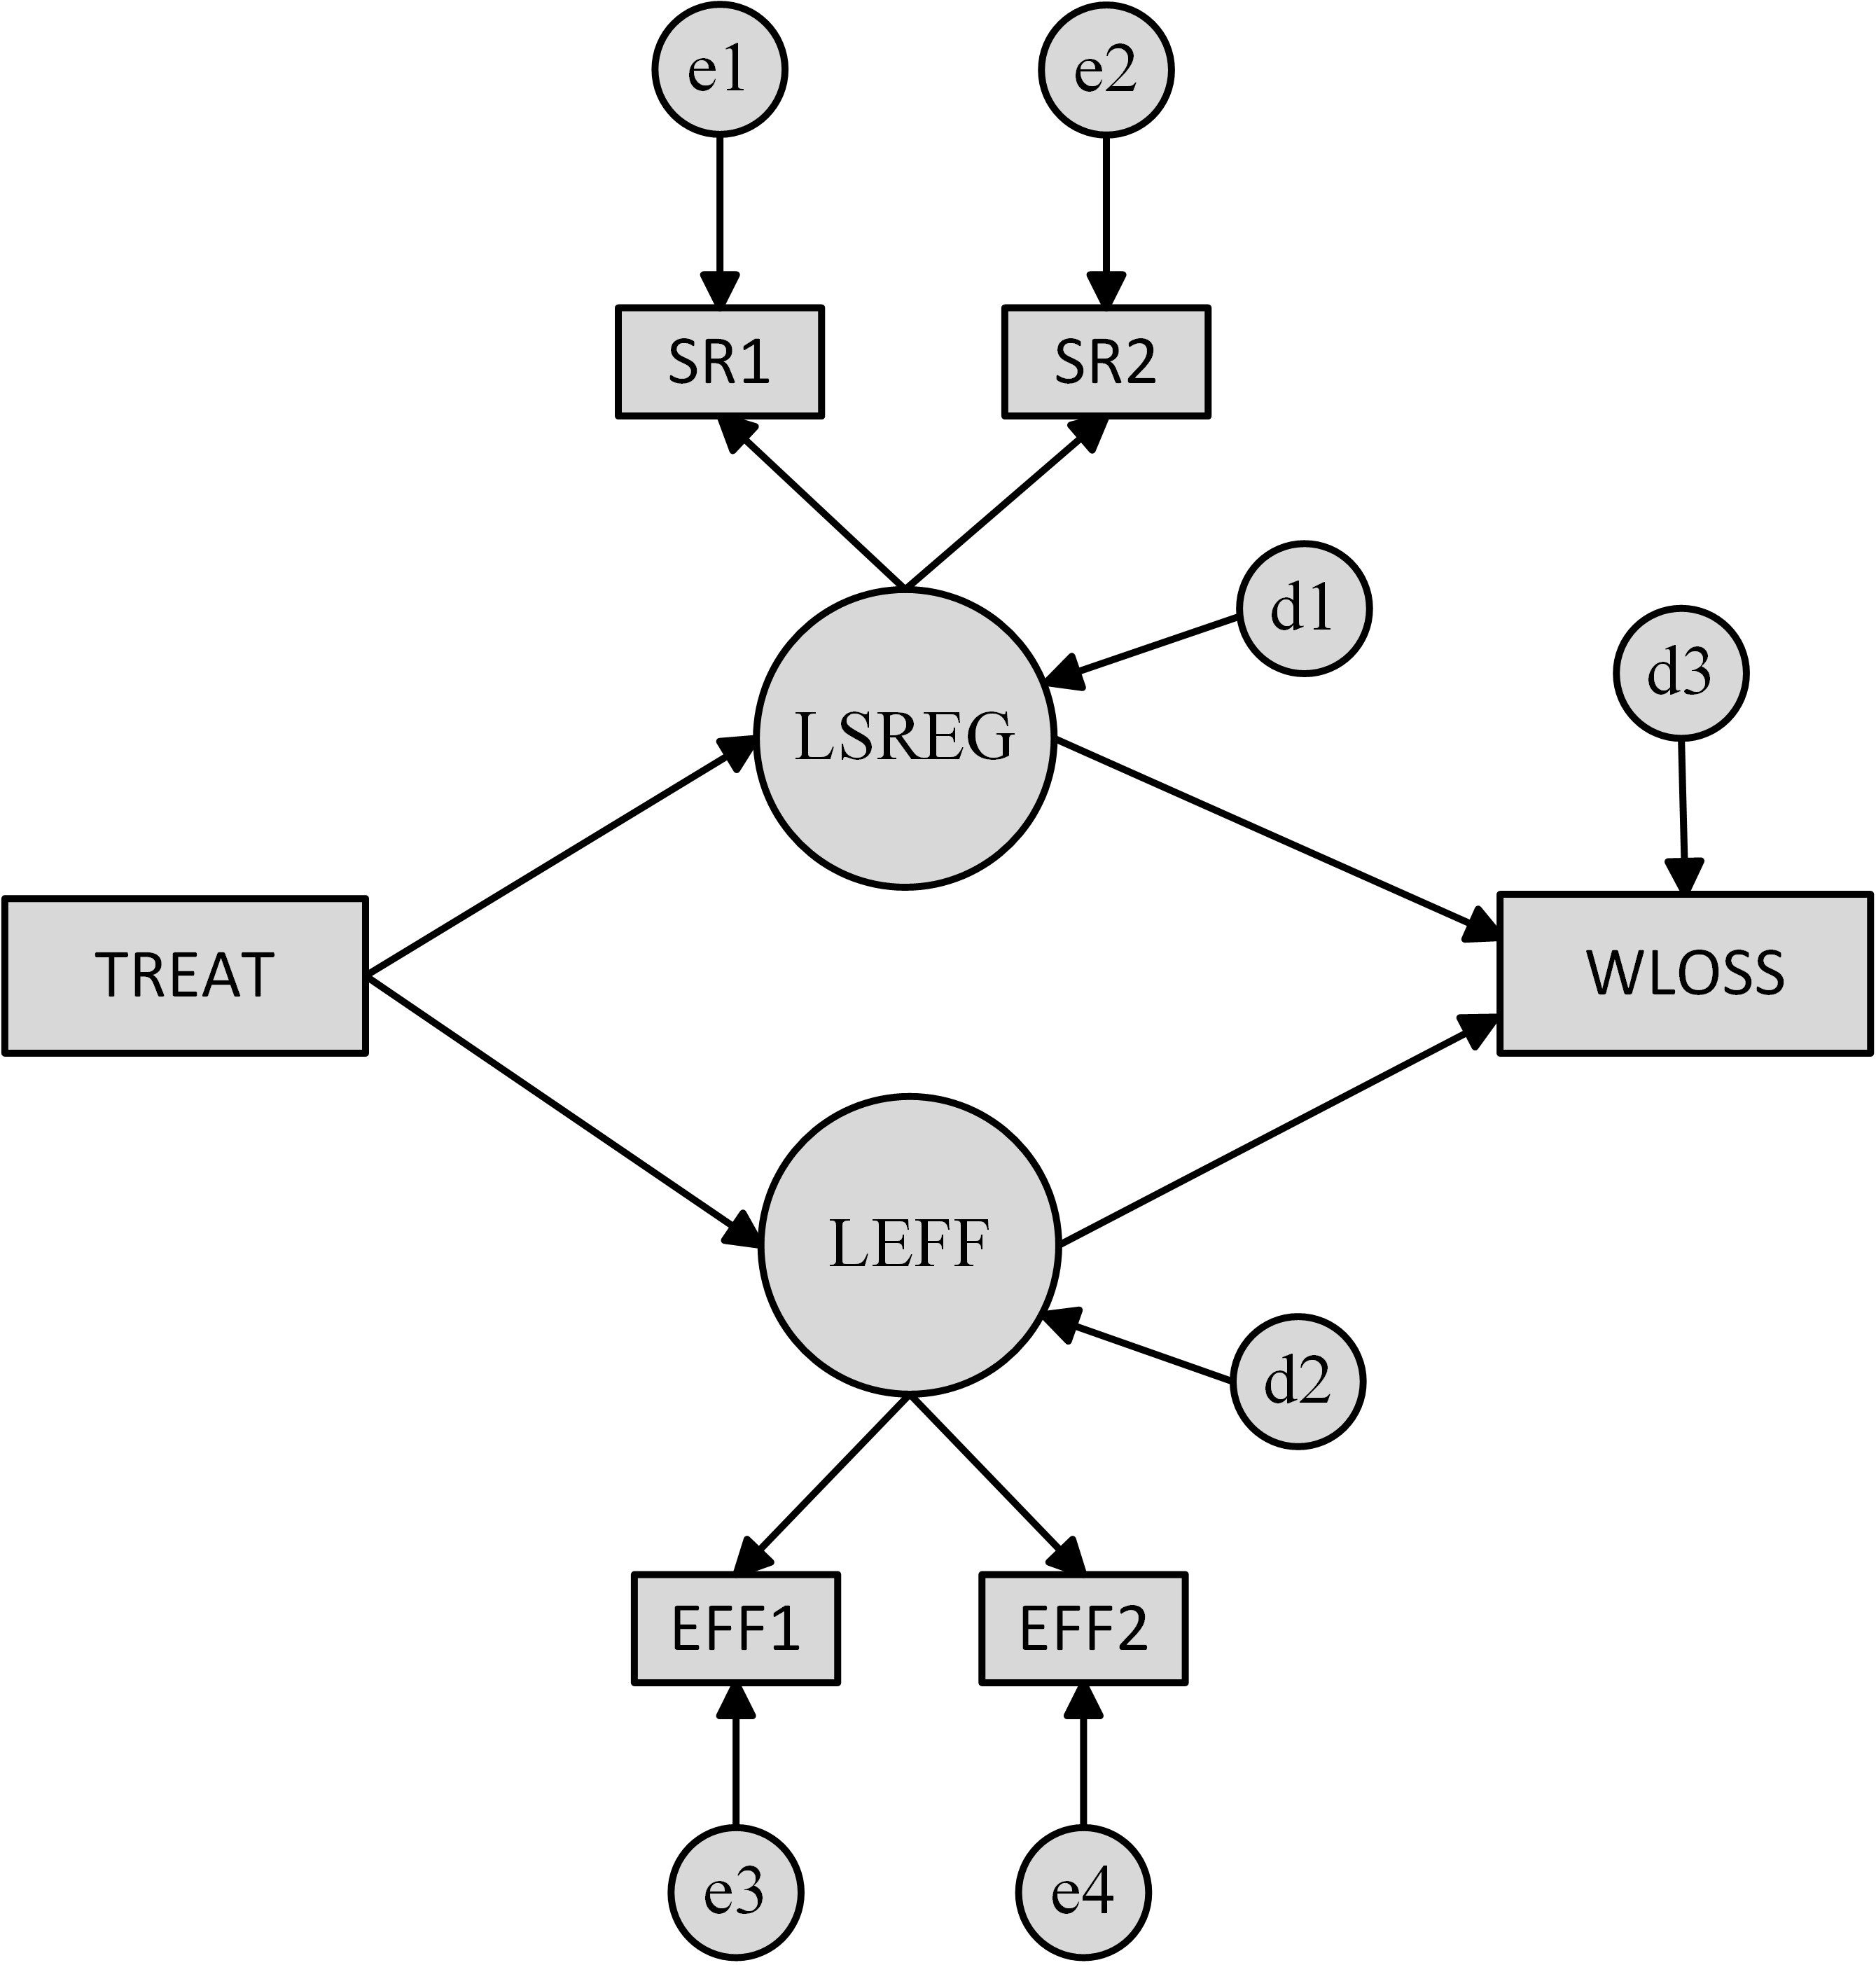
The example study examined a weight loss program for overweight individuals represented by a variable called TREAT (0 = control group, 1 = treatment group). Weight loss was measured in pounds in the variable called WLOSS. It is the number of pounds lost per month. Positive numbers equal pounds lost; negative numbers indicate pounds gained. There were two targeted program mediators, self regulation (higher tendencies to self regulate oneself leads to more weight loss) and self-efficacy for weight loss (higher confidence in one's ability to lose weight leads to more weight loss). Self regulation is measured by two indicators (SR1 and SR2), as is efficacy (EFF1 and EFF2). The indicators were the average response to multi-item inventories where each item was responded to on a 5 point scale (-2 = strongly disagree, -1 = moderately disagree, 0 = neither, 1 = moderately agree, 2 = strongly agree). Higher scores mean more SR and more EFF.
There are two latent variables, one for self regulation and one for self-efficacy. I label latent variables with the letter L. The e represent measurement error because the indicators are assumed to be interchangeable (see my book). The d are disturbances that reflect unmeasured variables assumed to impact the variables they point to. To keep things simple, I do not include any covariates, but normally these would be in the model. The influence diagram is to the left.
This page shows you annotated syntax for a contrived example. I use this example because it is amenable to explaining syntax without getting caught up in substantive details. I provide syntax with detailed commentary lines (! in Mplus and # in lavaan). Obviously, syntax under normal programming conditions would not include the extensive comments.
To see a diagram of your model after running it from Mplus, click on the menu item within the Mplus interface called ‘Diagram’ and then click on ‘View Diagram.’ You can edit the figure that appears using the 'View' menu item within the graphic file. To see a diagram in lavaan, you can use the R package SemPlot and input your executed lavaan model into it (see the command below).
Mplus Generated Diagram
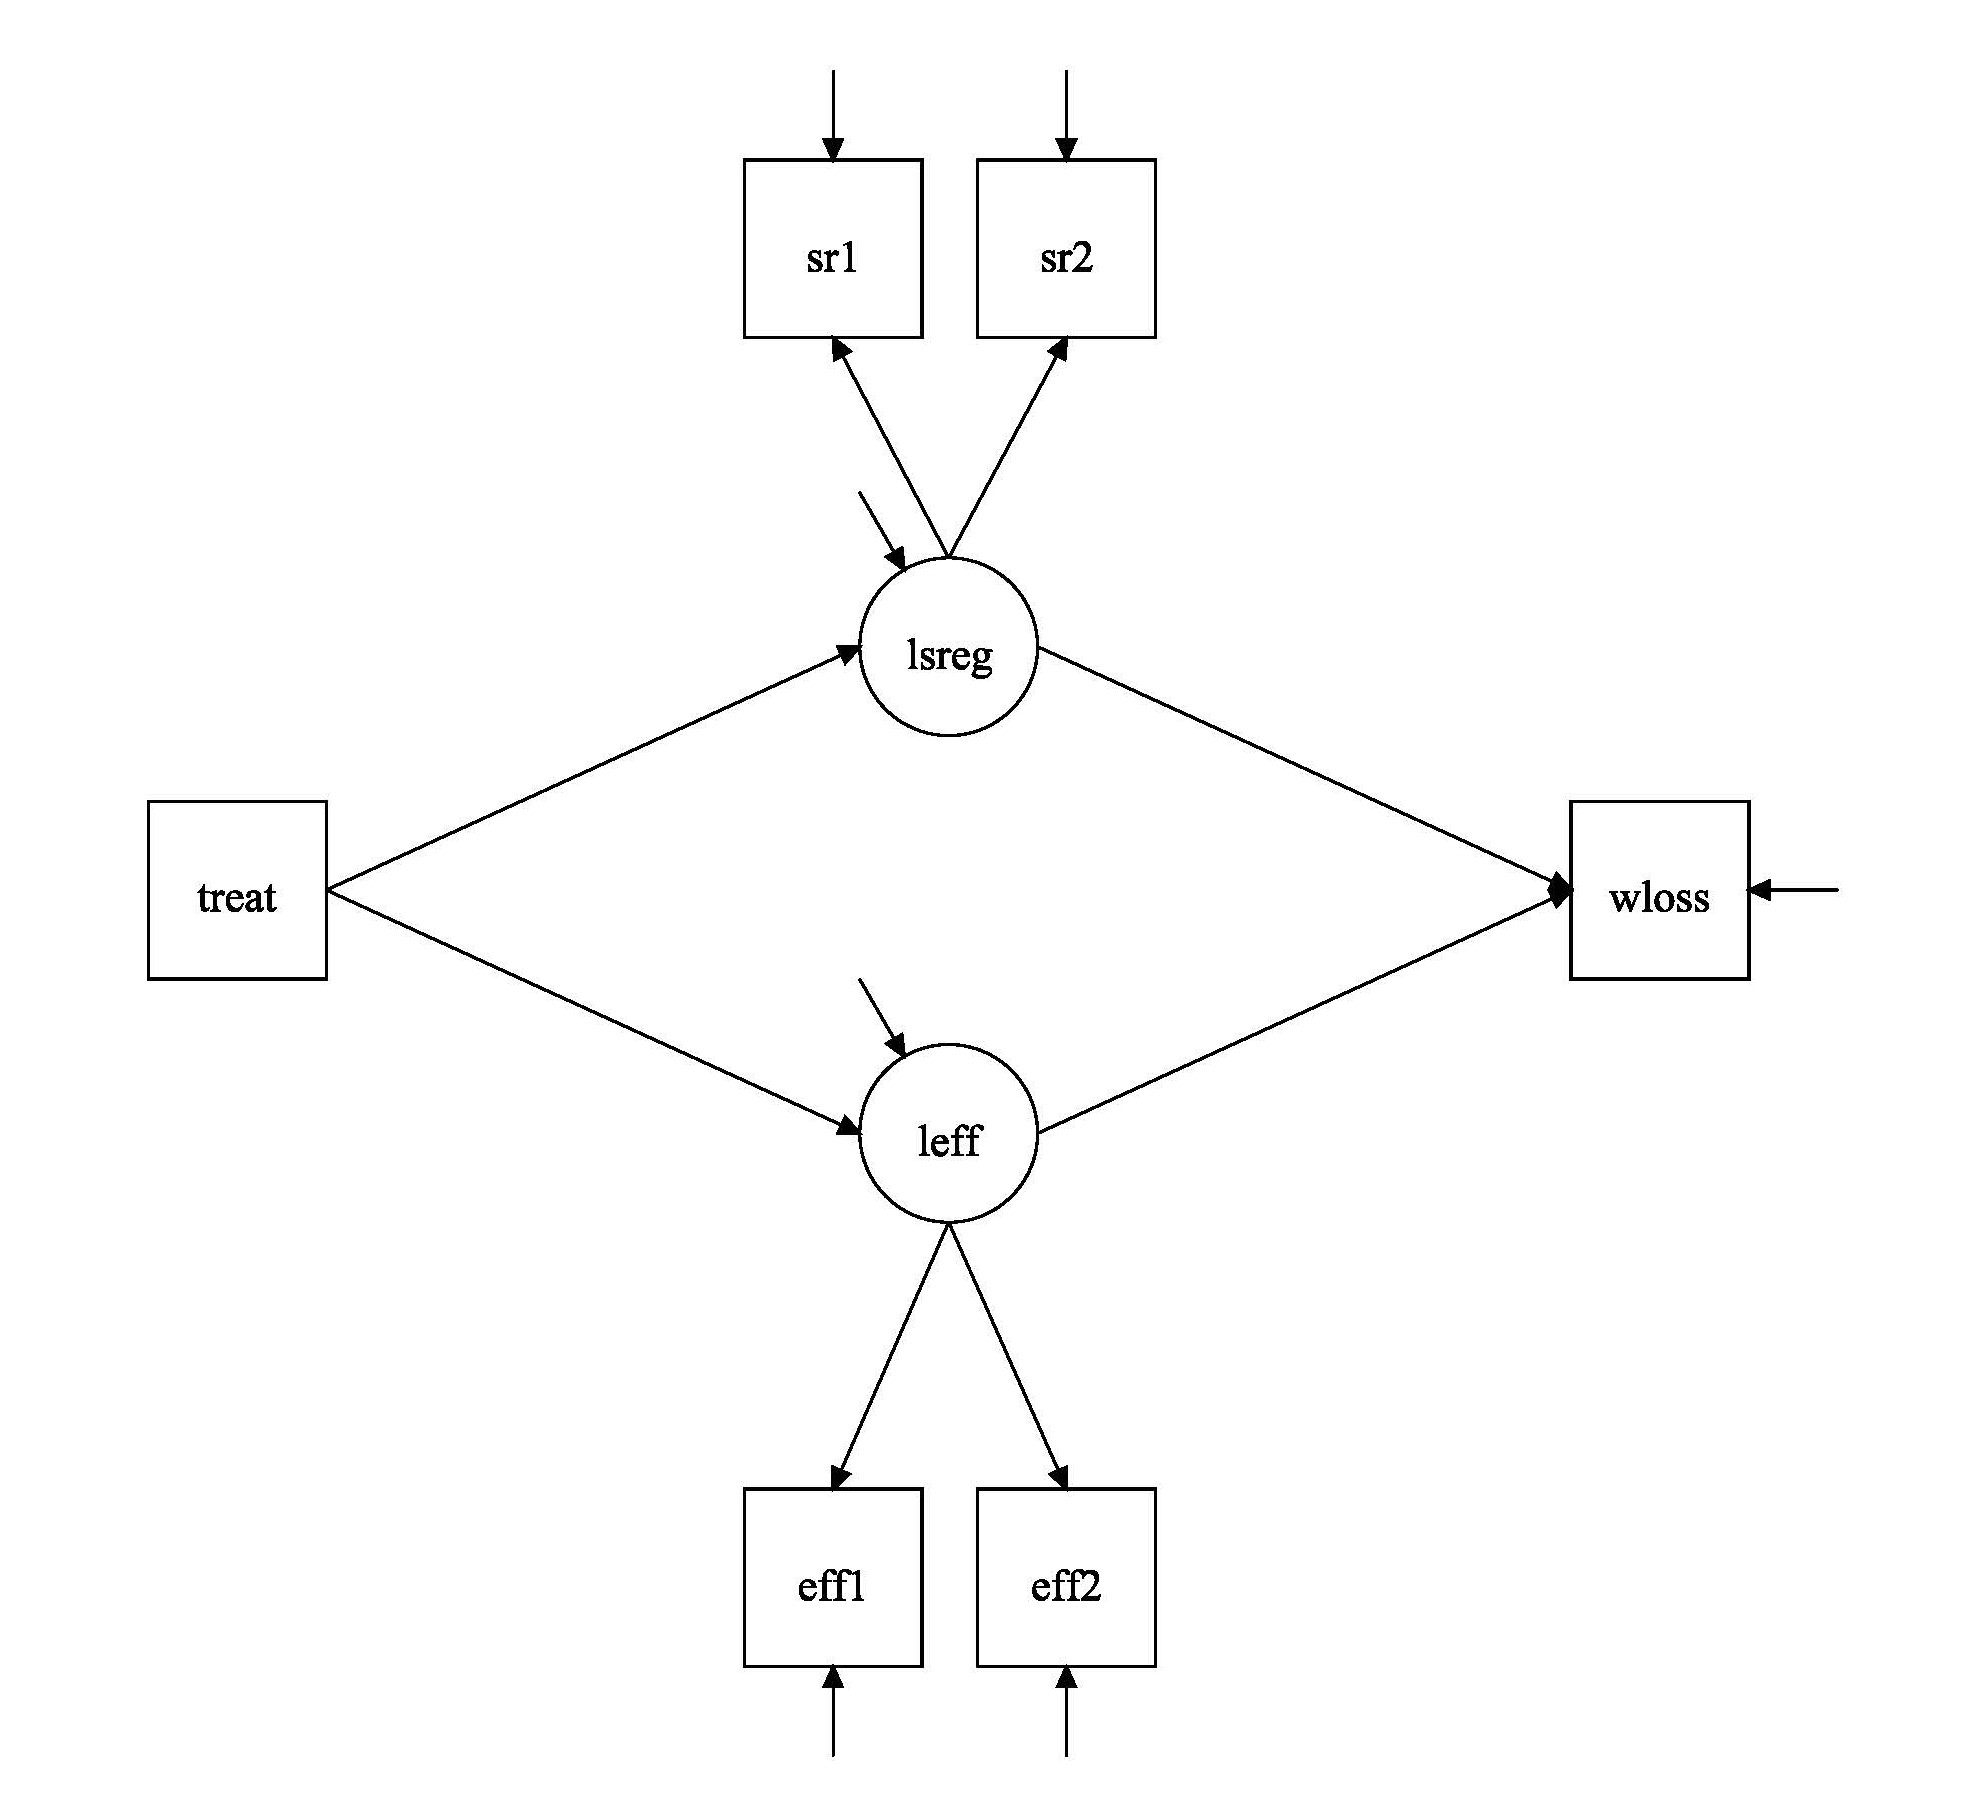
Mplus gives you the option to add to the diagram a variety of results in the form of unstandardized coefficients, standardized coefficients, etc. You can export the diagram to a pdf file and from that file, to an image file. You can edit the figure in multiple ways
semPlot Generated Diagram (semPaths(fit,title=FALSE,curvePivot=TRUE,intercepts=FALSE)
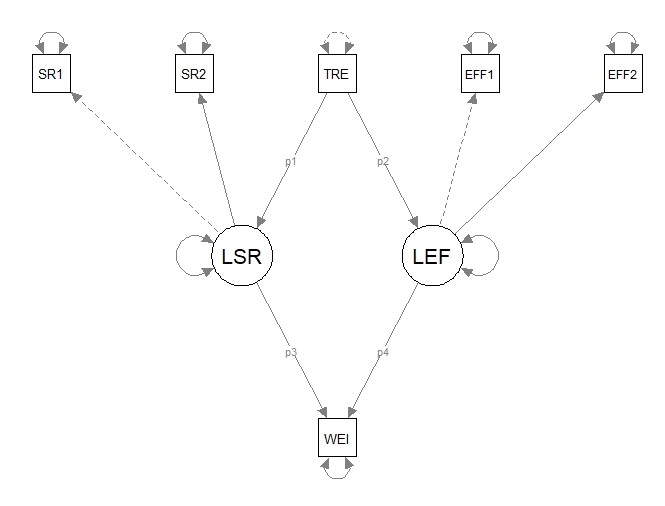
semPlot gives you the option to add to the diagram a variety of results in the form of unstandardized coefficients, standardized coefficients, etc. You can export the diagram to a pdf file, a jpg file, and many other formats.